
Financial Statement Version Creation
Now, we’re going to define the financial statement version, so that we can prepare balance sheets and profit and loss statements.
Thank you for reading this post, don't forget to subscribe!Alright. It’s over here. Let’s close this. Okay, this is the one. It’s under Financial Accounting (New), General Ledger Accounting (New), Master Data, G/L Accounts, Define Financial Statement Version. We’ll click this.

Press New Entries.

Enter, Sun. Sun Limited Financial Statement, maintain language, EN, just leave this, item keys, auto. Sun. The chart of account has to be sun because our chart of account name is Sun. That’s all. Then press this, financial statement items. Data was changed. Save changes first, yes.

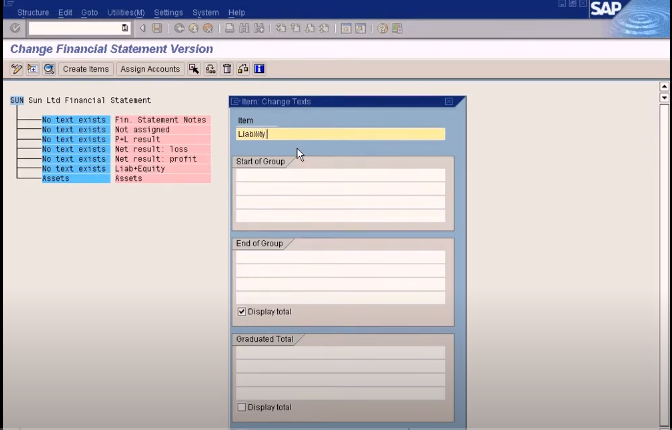
Okay. What you see here is a system defined financial statement items.

We’re not supposed to change any of these, okay, we can change the blue items here.

This is just the text of the assets. I’m going to change this to assets. Double click. Once again, if you double click here, you get these.

Just fill in assets, so that assets will be written here. This is a description that you can change for this financial statement item. This one you can’t really change. I can change that too. I advise not to do that to change this. All right, it’ll look like this. I’m going to enter liability plus accounting, and okay. Yep.
Now, the other one is P&L. This one. That’s P&L. Statement, it’s a P&L statement. This is loss for current period.

And this one is profit for current period.

Okay. Now, we can assign the accounts here. Let me assign the accounts. I’ll go to assets, press this, assign accounts. I choose asset accounts. My asset accounts start from building, machinery, so all the series starting from 1.

Choose Asset Account, and Ending Account is, here, this. This ending, Ending Series, okay, let me choose this.

Any accounts within these two ranges are considered Asset Accounts. You know this, right?

Let me just show you one thing. Let me just go to Account Group. I’ll show you how I got the range. Just go to Account Group. You know what an account group is. Here, here, Master Data, G/L Accounts, Preparations, Define Account Group. It’s loading. Okay, go to Sun. Alright. Remember, I told you the Assets Range.

So the range is Fixed Assets and Current Assets. Fixed assets starts with series one up to this. And then current assets from two-series up to this series. I’ll just put this range here. It’s the last range.

Just copy that, paste it here. Alright. So fixed assets plus current assets is going to become my assets, alright?

So the range is starting from here through here. Here, through here.

This line here, to here. See that? Just click, OK. Yeah, the system will show this message, indicate debit or credit.

What you are to do is to just list the debit, because you know for sure that asset accounts will have a debit balance, so you click debit here.

Then you click OK, so you have the range. Building, machinery, cash in bank, cash in hand, materials, trade debtors.

Alright, now we go to the liability side, similarly as in accounts, going to the liability and equity first. Assign accounts, long term liability plus current liability, alright. The starting range for current liability is this, copy that, put it here,


and the ending range should be, here, current liability.

So copy that, put it here.

Okay. Copy that.
Again, it’s asking me to specify debit or credit.

Liability will have a credit balance, so choose credit. Click, OK. If you click this, we have all the credit side of the balance sheet, or you can call this liability and equity. So what are these two? Let me explain.


Any account which does not fall in either liability, this group, or this group. Any account that does not fall in this list and this list. We’ll be considered as a P&L account, and will be listed here.

That’s how the system identifies the P&L accounts, and it will sum up the balances of the P&L accounts, and if the summation is positive, it’ll be displayed here as net result.


Because summation of P&L result, which results in a positive figure will be shown as a profit. Summation of P&L accounts, which result in a negative figure will be displayed here as a loss.

Okay, that’s how the system calculates the profit and loss of a balance sheet. So since these two are auto calculated by the system, we don’t have to enter anything here.

Even if you wanted to assign anything, the system won’t allow you to assign. Let me show you now. Assign accounts. See? You cannot assign any accounts to this node, because this is automatically assigned by the system, so you don’t have to assign anything. Once again, the way the system finds out which accounts are P&L accounts that need to be assigned here is by checking these two groups.


Any account that does not fall within these two groups will be considered a P&L account.

For example let me just show you something. Sample, I don’t have an example to show. Just wait.

Okay, we can just save it now. Save it. Okay, let me explain what this not assigned is.

Not assigned means any accounts that do not fall in this group or this group, and also, does not fall in the P&L group will be considered not assigned accounts. This is very rare, don’t worry about this. What is important is this, and this.

Okay, we have saved it. Go back. Now, let’s display our balance sheet now. Okay, let’s go here. Let’s open a new session. Okay, see this? Go to Accounting, Financial Accounting, General Ledger, Periodic Processing, Closing, Closing Reports, General Ledger Reports (New), Financial Statement, Cash Flow, General, Actual Comparisons, and this.

It’s quite a long menu path, but you can go directly using the T code here. This one, right?

Just put in Sun because the chart of accounts is Sun. The company code is Sun, financial statement origin is Sun.

Everything else, take the default. Financial statement version, Sun. You know why you’re putting the financial statement origin as Sun? You have named your financial statement here as Sun.

If you have given some other name, then follow the name exactly. This is also called FSV. It stands for Financial Statement Version.

So our FSV is Sun, so I’m putting Sun here. Reporting year, I want to see the balance for the current year, 2009, that’s why it’s here, 2009. Comparison year, you can compare the figures between 2009 figures and 2008 figures. It’s optional. We don’t have any figures for 2008, so it’s going to be blank. Let us run now.

Just take this, the execute control. Okay, just run it. Ah! See?

You can see our figures. These figures are taken from the journal entry we posted just now, where we uploaded the balance sheet figures. See, this is the liability side. We have capital plus bank loans, retained earnings, 20,000, cash in bank, 8,000, cash in hand, 2000, plus materials to 20,000.
Let me just open the document that we posted just now, FB03.


Now this is the one, let me just change to Sun, run it. Remember we posted the journal entry, where we uploaded the balance sheet figures. These are being shown here in this report now.

All right. Sun Limited Financial Statement. Looks good. Look at the comparison period of 2008, we didn’t post any figures, so it’s all empty. This absolute difference is this minus this. This 2009 figure minus 2008 figure, you get the absolute difference. That’s how you do comparisons.

Let’s go back. If any accounts are zero, they will not be displayed here.

You can see all the accounts that are displayed here are actually not zero.

I think we have more than these accounts, right? Let me just show you something. Zero, zero. Actually, we have some accounts for which there are no postings yet.

For example, building. See?

This account will not be displayed here because it is zero.

If at all, you wanted to display all accounts with a zero balance, you need to tick the flag. Let me show you. Come here, this summary here, special evaluation. Do you see this flag, accounts with zero balance? I want to display accounts with zero balance, so I just put a tick here, then execute.

Do you see? All these are zero. Zero. Zero. Now it’s being displayed.

Trade creditors, buildings, this, earlier did not display. Now it’s being displayed.

That’s the information. Then, what else can I show? Let me just scroll this back to evaluation. All right. Now we can display. Now our currency is USD, right? We can display the figures in Euro. Just put Euro here. Check currency. Let’s execute and see what happens.

See, the currency has been changed to Euro. What was our capital earlier? 20,000, right? I’ll just check our capital.

Let me open the document again. Okay, the capital was 10,000 USD, right?

See here now, it’s showing the Euro value now. That’s something interesting.

I can do that here. Alright. It will convert the USD amount to a Euro amount using the exchange rate defined in the system. Okay. I’ll show you how to define exchange rate for foreign currency posting. It comes in additional relations transaction section.
And let me just show you some of these. Let’s remove this so I can see the USD balance again.

Alright, so far so good. Okay, one more thing. If you want to download this report to an actual file, just do this, export to, Local File, Spreadsheet, hit OK.

You must point to a place to download. I’ll just point to my desktop. Balance Sheet. OK. Generate.

Let us bring you to the actual file. Let me just show you this. I’ll just open it. See this? See this? Of course, it’s not in a good order. You have to do a lot of massaging in Excel, but it looks good like this.


This is how you export figures to Excel files. Now let us go back to the financial statements. Let me just close this.
You may watch the full course on the following YouTube link
https://www.youtube.com/watch?v=dkaJ8Pa-O9c&list=PLN17Nn94liux88cwVwqbiRQQo1qK4sOdQ&index=8&pp=iAQB